You should compare before and after Google Search Console data during an SEO drop by checking clicks, impressions, CTR, average position, queries, pages, countries, devices, and search appearance across the time period before the drop and after the drop.
This helps you understand what actually changed.
An SEO drop can happen because of:
- Lost rankings
- Lost impressions
- Lower CTR
- Technical SEO issues
- Indexing problems
- Content decay
- Search intent changes
- Competitor improvements
- Website migration mistakes
- URL changes
- Internal link changes
- Google updates
- SERP feature changes
- AI Overview impact
- Seasonal demand changes
- Tracking confusion
The biggest mistake is looking only at total traffic.
Total traffic tells you that something dropped.
It does not tell you why.
As an SEO expert and website developer, I always compare GSC data before making changes. I want to know whether the issue came from a specific page, keyword group, device, country, search type, or technical change.
At Nexora Creation, I use before-and-after GSC comparisons to separate real SEO problems from normal fluctuations, seasonal drops, and tracking issues.
In this guide, I will show you how to compare before and after GSC data during an SEO drop, what metrics to check, how to diagnose the cause, and how to turn the data into a recovery plan.
If you need a professional diagnosis instead, our SEO audit and ranking recovery service finds the real cause and ranks every fix by impact.
What does comparing before and after GSC data mean?
Comparing before and after GSC data means reviewing your website performance before the SEO drop and comparing it with performance after the drop.
You compare:
- Clicks before vs clicks after
- Impressions before vs impressions after
- CTR before vs CTR after
- Average position before vs average position after
- Queries before vs queries after
- Pages before vs pages after
- Devices before vs devices after
- Countries before vs countries after
- Search appearance before vs after
- Branded vs non-branded traffic
- Blog traffic vs service-page traffic
- Desktop vs mobile visibility
- High-intent queries vs informational queries
The goal is simple.
You want to answer:
“What changed?”
Once you know what changed, you can diagnose why it changed.
Why should you compare GSC data during an SEO drop?
You should compare GSC data during an SEO drop because guessing can make the problem worse.
Without comparison data, you may:
- Rewrite the wrong page
- Delete useful content
- Change URLs unnecessarily
- Blame a Google update incorrectly
- Ignore technical SEO issues
- Miss indexing problems
- Refresh content that does not need updating
- Ignore lost internal links
- Overlook mobile-only drops
- Miss high-value keyword losses
- Focus on traffic instead of leads
A good before-and-after comparison helps you identify:
- Which pages lost visibility
- Which queries declined
- Whether impressions or clicks dropped first
- Whether CTR collapsed
- Whether average position changed
- Whether the drop affected mobile or desktop
- Whether the issue affected one country
- Whether the issue affected branded or non-branded searches
- Whether service pages or blogs dropped
- Whether the drop connects to leads
Before you fix SEO, you need to understand the pattern.
What date ranges should you compare in GSC?
The best date range depends on the type of SEO drop.
Use short comparisons for sudden drops and longer comparisons for gradual declines.
Useful date ranges include:
- Last 7 days vs previous 7 days
- Last 28 days vs previous 28 days
- Last 3 months vs previous 3 months
- Last 6 months vs previous 6 months
- Last 12 months vs previous 12 months
- Same period this year vs same period last year
For sudden SEO drops, start with:
- Last 7 days vs previous 7 days
- Last 28 days vs previous 28 days
For content decay, use:
- Last 3 months vs previous 3 months
- Last 6 months vs previous 6 months
For seasonal businesses, use:
- Same period this year vs same period last year
For example, if a pool company loses traffic in winter, comparing January to December may mislead you.
A year-over-year comparison may show whether the drop is seasonal or real.
How do you set up a date comparison in Google Search Console?
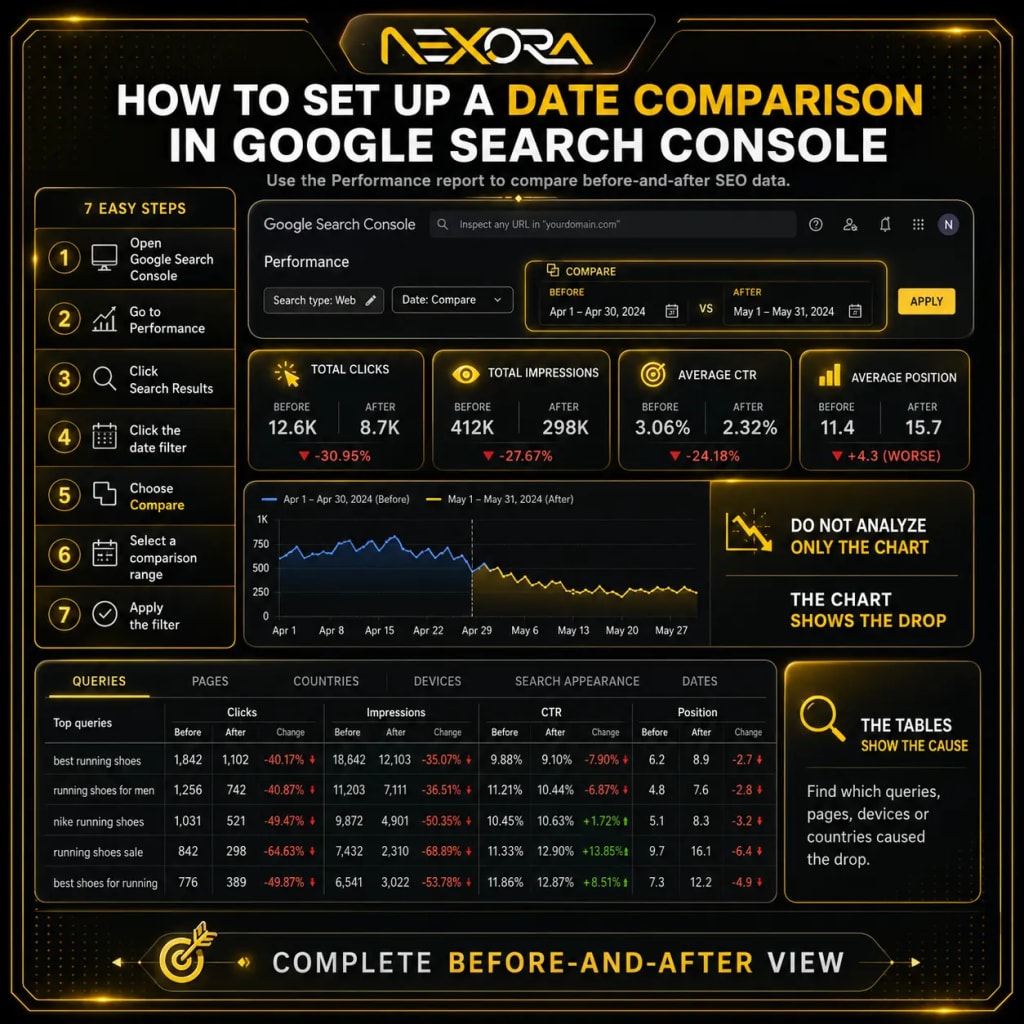
You can set up a date comparison inside the Performance report.
Follow this workflow:
- Open Google Search Console.
- Go to Performance.
- Click Search Results.
- Click the date filter.
- Choose Compare.
- Select a comparison range.
- Apply the filter.
- Turn on all four metrics.
Turn on:
- Total clicks
- Total impressions
- Average CTR
- Average position
Then review:
- Queries
- Pages
- Countries
- Devices
- Search appearance
- Dates
This gives you a complete before-and-after view.
Do not analyze only the chart.
The chart shows the drop.
The tables show the cause.
Which GSC metrics should you compare first?
Start with the four main metrics.
Compare:
- Clicks
- Impressions
- CTR
- Average position
Each metric tells a different story.
What does a click drop mean?
A click drop means fewer users came to your website from Google Search.
Clicks can drop because:
- Rankings dropped
- Impressions dropped
- CTR dropped
- Search demand changed
- SERP features reduced clicks
- AI Overviews answered the query
- Titles became less attractive
- Competitors improved snippets
- The page lost visibility
What does an impression drop mean?
An impression drop means Google showed your website less often.
Impressions can drop because:
- Rankings declined
- Search demand declined
- Content became less relevant
- Page was deindexed
- Google selected another page
- Query visibility declined
- Technical SEO issues appeared
- Search intent changed
What does a CTR drop mean?
A CTR drop means users saw your result but clicked less often.
CTR can drop because:
- Title tag is weak
- Meta description is weak
- SERP features changed
- AI Overview appeared
- Competitor titles improved
- Your result looks outdated
- Search intent mismatch increased
- Average position dropped
What does average position drop mean?
Average position drop means your rankings got worse across selected queries.
Average position can drop because:
- Competitors improved
- Content decayed
- Technical SEO issues appeared
- Internal links weakened
- Backlinks were lost
- Google chose another canonical
- Search intent changed
- Page quality declined
Do not read one metric alone.
Compare all four together.
How do you read different GSC drop patterns?
Different metric patterns show different problems.
What does clicks down and impressions down mean?
This usually means visibility declined.
Possible causes:
- Ranking drop
- Indexing issue
- Technical SEO issue
- Content decay
- Search demand drop
- Competitors improved
- Search intent changed
- Page removed or redirected
What does impressions stable but clicks down mean?
This usually means CTR dropped.
Possible causes:
- Title is less attractive
- Meta description is weak
- SERP features changed
- AI Overview appeared
- Ads increased
- Local pack appeared
- Competitor result looks better
- Your result looks outdated
What does average position down and impressions down mean?
This usually means ranking loss.
Possible causes:
- Competitor content improved
- Technical SEO issue
- Internal links weakened
- Backlinks lost
- Canonical issue
- Content quality declined
- Search intent mismatch
What does impressions up but clicks down mean?
This can mean Google is showing your page for more searches, but those searches may not be relevant.
Possible causes:
- Query mismatch
- Broader visibility but lower relevance
- SERP feature impact
- Weak CTR
- Page ranking for wrong intent
What does clicks down but average position stable mean?
This may mean SERP behavior changed.
Possible causes:
- AI Overviews
- Featured snippets
- Ads
- Video results
- Local pack
- Stale titles
- Weak meta description
- Lower demand
This is why comparing metrics together matters.
How do you compare queries before and after an SEO drop?
Queries show which search terms changed.
Open:
- Performance
- Search Results
- Queries
Then compare the selected date ranges.
Look for:
- Queries with clicks lost
- Queries with impressions lost
- Queries with position decline
- Queries with CTR decline
- Queries that disappeared from the top list
- Queries that increased but did not bring clicks
- Queries that shifted to another page
- Queries that have buyer intent
- Queries that previously drove leads
Sort by:
- Click difference
- Impression difference
- Position difference
- CTR difference
Then group queries into categories:
- Branded queries
- Non-branded queries
- Service queries
- Blog queries
- Local queries
- Informational queries
- Buyer-intent queries
- Comparison queries
- Problem-aware queries
This helps you understand whether the drop affected revenue or only broad traffic.
How do you compare pages before and after an SEO drop?
Pages show which URLs lost visibility.
Open:
- Performance
- Search Results
- Pages
Then compare date ranges.
Look for pages with:
- Lost clicks
- Lost impressions
- Lower CTR
- Lower average position
- Sudden drop
- Gradual decline
- High previous traffic
- Service relevance
- Lead-generation value
Then click each affected page and review its queries.
This tells you which keywords dropped for that URL.
Prioritize pages that support:
- Leads
- Consultations
- Quote requests
- Phone calls
- Service visibility
- Local rankings
- Sales pipeline
- Topical authority
A blog losing 100 broad informational clicks may matter less than a service page losing 20 high-intent clicks.
Always connect GSC data to business value.
How do you compare branded vs non-branded queries?
Branded and non-branded drops mean different things.
Branded queries include your company name or variations.
For Nexora Creation, branded queries may include:
- Nexora Creation
- Nexora Creation SEO
- Nexora Creation website development
- Nexora agency
- Nexora CRM services
Non-branded queries may include:
- SEO services
- Website development company
- CRM automation services
- AI chatbot for business
- Content not generating leads
- Technical SEO issues
- Lost keywords in Google Search Console
If branded traffic drops, check:
- Brand demand
- Reputation issues
- Website indexing
- Homepage visibility
- Google Business Profile
- SERP changes
- Competitor ads on your brand
- Tracking issues
If non-branded traffic drops, check:
- Rankings
- Content decay
- Technical SEO
- Search intent
- Competitors
- Internal links
- Service-page quality
Non-branded drops usually matter more for growth SEO.
Branded drops may indicate visibility, reputation, or tracking issues.
How do you compare device data during an SEO drop?
Device comparison helps you find mobile or desktop-specific issues.
Open:
- Performance
- Search Results
- Devices
Compare:
- Desktop
- Mobile
- Tablet
Look for:
- Mobile clicks down
- Mobile impressions down
- Mobile CTR down
- Mobile position down
- Desktop stable but mobile down
- Mobile stable but desktop down
Mobile-specific drops may indicate:
- Slow mobile speed
- Poor mobile UX
- Broken mobile menu
- Hidden content
- CTA issues
- Mobile indexing issues
- Layout shift
- Popups covering content
- Forms hard to use
- Core Web Vitals issues
If mobile traffic dropped after a redesign, check the mobile version immediately.
A page can look perfect on desktop but fail on mobile.
How do you compare country data during an SEO drop?
Country data helps you see whether the drop is global or location-specific.
Open:
- Performance
- Search Results
- Countries
Compare before and after.
Look for:
- One country dropped
- All countries dropped
- Service-area country dropped
- Irrelevant countries increased
- Target market lost visibility
- Local rankings declined
If only one country dropped, check:
- Local search intent
- Country-specific competitors
- Local service pages
- hreflang, if relevant
- Location signals
- Google Business Profile
- Regional demand
- Backlinks from local sources
For local service businesses, the target country or city matters more than global traffic.
A website may gain traffic from irrelevant countries while losing qualified local traffic.
That can make total traffic look stable while leads drop.
How do you compare search appearance data?
Search appearance shows whether rich results or special search features changed.
Open:
- Performance
- Search Results
- Search appearance
Depending on your site, you may see:
- Rich results
- FAQ results
- Product results
- Review snippets
- Video results
- Web Light results
- Translated results
- Merchant listings
Compare before and after.
Look for:
- Rich result clicks lost
- FAQ visibility lost
- Video visibility changed
- Review snippet visibility dropped
- Product impressions changed
If search appearance changed, check:
- Structured data
- Schema errors
- Template changes
- Plugin updates
- Review markup
- FAQ content
- Breadcrumb markup
- Video markup
- Product markup
A search appearance change may reduce CTR even if rankings stay similar.
How do you compare dates to find the exact drop point?
The Dates tab can help identify when the drop started.
Open:
- Performance
- Search Results
- Dates
Look for:
- Exact day traffic dropped
- Gradual decline
- Weekend/weekday pattern
- Drop after launch
- Drop after plugin update
- Drop after migration
- Drop after content changes
- Drop after Google update
- Drop after hosting issue
Then match the date with website changes.
Ask:
- Did we redesign the site?
- Did we update plugins?
- Did we change URLs?
- Did we update robots.txt?
- Did we change canonicals?
- Did we publish or remove pages?
- Did hosting go down?
- Did we change tracking?
- Did we update navigation?
- Did we remove internal links?
The drop date often reveals the cause.
How do you compare before and after data after a website migration?
Website migrations need careful GSC comparison.
Compare before and after migration using:
- Old URLs
- New URLs
- Top pages
- Top queries
- Branded queries
- Non-branded queries
- Sitemap URLs
- Indexed pages
- Clicks
- Impressions
- CTR
- Average position
Check:
- Did old URLs redirect correctly?
- Did new URLs replace old URLs?
- Did rankings transfer?
- Did service pages keep visibility?
- Did blog URLs change?
- Did internal links update?
- Did sitemap include new URLs?
- Did canonicals point correctly?
- Did noindex tags remain from staging?
- Did robots.txt block anything?
A migration drop often comes from:
- Missing redirects
- Wrong redirects
- Lost content
- Broken internal links
- Noindex tags
- Canonical issues
- Sitemap issues
- URL structure changes
- Slow page speed
- Lost metadata
If your SEO drop started after a migration or redesign, Nexora Creation can help review technical SEO, redirects, internal links, and page structure through Website Development Services.
How do you compare GSC data after a content update?
After updating content, compare the page before and after the refresh.
Use:
- 28 days before update vs 28 days after update
- 3 months before update vs 3 months after update
- Same period year-over-year for seasonal pages
Check:
- Did impressions increase?
- Did clicks increase?
- Did CTR improve?
- Did average position improve?
- Did more queries appear?
- Did high-intent queries recover?
- Did long-tail visibility improve?
- Did service-page clicks increase?
- Did leads increase?
Do not judge content updates too quickly.
Google may need time to recrawl and reassess the page.
Track:
- 30 days after update
- 60 days after update
- 90 days after update
For important pages, maintain a content update log.
Include:
- URL
- Update date
- Main query
- Reason for update
- Sections improved
- Internal links added
- Title/meta changes
- CTA changes
- Performance before
- Performance after
- Lead impact
This makes SEO recovery measurable.
How do you compare GSC data after a technical SEO fix?
Technical fixes should be measured carefully.
Compare before and after fixing:
- Noindex issues
- Robots.txt blocks
- Canonical mistakes
- Redirect errors
- 404 pages
- Sitemap problems
- Server errors
- Mobile usability issues
- Page speed problems
- Internal link problems
Check:
- Is the page indexed again?
- Did Google recrawl the URL?
- Did impressions return?
- Did clicks return?
- Did average position improve?
- Did the correct canonical show?
- Did sitemap status improve?
- Did affected queries come back?
- Did service-page visibility recover?
Use URL Inspection for affected pages.
Check:
- Indexing status
- Last crawl
- Crawl allowed
- Indexing allowed
- User-declared canonical
- Google-selected canonical
- Page fetch
- Referring page
- Sitemap discovery
Technical SEO recovery can take time.
But if the issue was severe, fixing it can create strong recovery.
How do you compare CTR before and after rewriting titles?
CTR comparison helps you see whether title and meta updates worked.
Use this workflow:
- Choose a page with high impressions and low CTR.
- Record current title and meta description.
- Record current clicks, impressions, CTR, and position.
- Rewrite the title to match intent.
- Rewrite the meta description to show value.
- Wait for Google to recrawl and update the snippet.
- Compare 28 days before vs 28 days after.
Track:
- CTR change
- Clicks change
- Impressions change
- Average position change
- Query relevance
- Lead quality
A CTR improvement does not always mean rankings improved.
It means more people clicked when they saw your result.
That can be a fast win.
Example weak title:
“SEO Drop Guide”
Better title:
“How to Compare Before and After GSC Data During an SEO Drop”
Example weak meta description:
“Learn about SEO drops and reports.”
Better meta description:
“Learn how to compare before and after GSC data during an SEO drop, find lost queries, diagnose page issues, and plan ranking recovery.”
How do you compare query intent before and after a drop?
Query intent comparison helps you see whether Google is matching your page to the right searches.
Export query data before and after the drop.
Group queries into:
- Buyer-intent queries
- Problem-aware queries
- Informational queries
- Local queries
- Branded queries
- Comparison queries
- Irrelevant queries
Then compare:
- Which group lost clicks?
- Which group lost impressions?
- Which group gained impressions but no clicks?
- Which group lost average position?
- Which group still drives service-page visits?
- Which group generated leads before?
- Which group has no business value?
This is important because total impressions can mislead you.
A page may gain impressions from irrelevant queries and lose clicks from buyer-intent queries.
That means visibility looks stable, but business value dropped.
How do you compare service pages vs blog pages?
Service pages and blog pages behave differently.
Service pages usually target commercial intent.
Blog pages often target informational or problem-aware intent.
Compare both separately.
What should you check on service pages?
Check:
- Main service queries
- Local queries
- Branded queries
- Non-branded queries
- Clicks
- Impressions
- CTR
- Average position
- Phone calls
- Form submissions
- Consultation requests
- Internal links from blogs
- Google Business Profile traffic
What should you check on blog pages?
Check:
- Informational queries
- Problem-aware queries
- Long-tail queries
- Internal clicks to service pages
- CTA clicks
- Assisted conversions
- Content decay
- Search intent match
- CTR
- Query relevance
A service-page drop may affect leads quickly.
A blog drop may affect traffic, topical authority, and assisted conversions.
Both matter.
But they need different fixes.
How do you compare GSC data with Google Analytics?
Google Search Console and Google Analytics measure different things.
GSC shows search visibility.
Google Analytics shows user behavior after the click.
Compare GSC with Analytics to understand the full SEO drop.
Use GSC to check:
- Queries
- Pages
- Clicks
- Impressions
- CTR
- Average position
Use Google Analytics to check:
- Organic sessions
- Engagement
- Landing pages
- Form submissions
- Phone clicks
- Chatbot starts
- Service-page views
- Key events
- Assisted conversions
Possible patterns:
- GSC clicks down and GA organic sessions down
SEO visibility likely dropped. - GSC clicks stable but GA sessions down
Tracking or analytics issue may exist. - GSC clicks stable but leads down
Conversion path, forms, CRM, or offer may be the problem. - GSC clicks down but leads stable
Lost traffic may not have been high quality. - GSC clicks up but leads down
You may be attracting the wrong audience.
This is how you connect SEO data with business outcomes.
How do you compare GSC data with CRM leads?
CRM data helps you understand lead quality.
SEO is not only about rankings.
It should support qualified enquiries.
Compare GSC data with CRM data.
Check:
- Which pages generated leads before the drop?
- Which pages stopped generating leads?
- Which service queries declined?
- Which blog posts assisted leads?
- Which pages sent visitors to forms?
- Which pages generated calls?
- Which pages produced low-quality leads?
- Which pages produced booked consultations?
CRM data can show whether a traffic drop actually matters.
For example:
A page may lose 500 clicks but zero leads.
Another page may lose 20 clicks but 5 qualified enquiries.
The second drop may be more important.
If your SEO reporting does not connect queries, pages, forms, calls, and CRM pipeline, Nexora Creation can help connect SEO analytics with CRM automation.
How do you export GSC data for deeper analysis?
Exporting GSC data helps you compare before and after more clearly.
You can export from the Performance report.
Export:
- Queries
- Pages
- Countries
- Devices
- Search appearance
- Dates
Use:
- Google Sheets
- Excel
- Looker Studio
- SEO reporting dashboard
Create columns for:
- Clicks before
- Clicks after
- Click difference
- Impression before
- Impression after
- Impression difference
- CTR before
- CTR after
- CTR difference
- Position before
- Position after
- Position difference
- Intent category
- Page type
- Priority
- Recommended fix
Then sort by:
- Biggest click loss
- Biggest impression loss
- Biggest position loss
- Highest business value
- Service-page importance
- Lead impact
This turns messy SEO data into a recovery plan.
How do you build a before-and-after SEO drop dashboard?
A dashboard helps you monitor recovery.
Useful dashboard sections include:
- Total organic clicks
- Total organic impressions
- CTR
- Average position
- Top losing queries
- Top losing pages
- Service-page performance
- Blog performance
- Branded vs non-branded traffic
- Device performance
- Country performance
- Lead events
- Form submissions
- Phone clicks
- CRM leads
- SEO fixes completed
- Recovery status
Useful filters include:
- Page type
- Service category
- Blog category
- Country
- Device
- Date range
- Branded vs non-branded
- Buyer intent vs informational
A dashboard helps avoid emotional SEO decisions.
You can see whether fixes are working.
How do you create an SEO drop diagnosis table?
A diagnosis table makes your audit easier.
Use columns like:
- Affected page
- Main lost query
- Clicks before
- Clicks after
- Click difference
- Impressions before
- Impressions after
- Impression difference
- CTR before
- CTR after
- Average position before
- Average position after
- Likely cause
- Priority
- Recommended fix
- Service relevance
- Lead impact
- Owner
- Status
Example diagnosis:
- Page: SEO Services
- Query: local SEO services
- Clicks before: 120
- Clicks after: 55
- Impressions before: 4,000
- Impressions after: 2,100
- Position before: 5.2
- Position after: 11.8
- Likely cause: content gap + competitor improvement
- Fix: update service page, add FAQs, improve internal links
- Priority: high
This format helps teams act faster.
How do you decide what to fix after comparing GSC data?
After comparing data, choose the fix based on the pattern.
What should you fix if impressions dropped?
Check:
- Ranking loss
- Indexing status
- Search demand
- Search intent
- Technical SEO
- Internal links
- Content decay
- Competitor changes
Fix:
- Update content
- Improve internal links
- Check indexing
- Review SERP
- Add missing sections
- Strengthen topical authority
What should you fix if CTR dropped?
Check:
- Title tag
- Meta description
- SERP layout
- AI Overview
- Ads
- Rich results
- Competitor snippets
- Search intent mismatch
Fix:
- Rewrite title
- Rewrite meta description
- Add structured data
- Improve page freshness
- Match intent better
What should you fix if average position dropped?
Check:
- Competitor content
- Internal links
- Backlinks
- Content quality
- Technical SEO
- Canonicals
- Page experience
- Search intent
Fix:
- Refresh content
- Improve page depth
- Add internal links
- Fix technical issues
- Improve EEAT
- Strengthen service-page relevance
What should you fix if clicks dropped but leads did not?
Check whether lost traffic was low value.
Do not overreact.
Focus on pages and queries that support leads.
What should you fix if leads dropped but GSC clicks did not?
Check:
- Forms
- Phone tracking
- CRM connection
- CTA placement
- Landing page UX
- Offer clarity
- Chatbot handoff
- Lead follow-up
This may be a conversion problem, not an SEO problem.
How do you avoid mistakes when comparing GSC data?
Avoid these common mistakes:
- Comparing random date ranges
- Ignoring seasonality
- Looking only at total clicks
- Ignoring impressions
- Ignoring CTR
- Ignoring average position
- Ignoring pages
- Ignoring query intent
- Ignoring mobile vs desktop
- Ignoring country filters
- Mixing branded and non-branded queries
- Comparing different search types
- Forgetting recent website changes
- Ignoring indexing issues
- Exporting data but not grouping it
- Fixing low-value keywords first
- Ignoring lead impact
A clean comparison should answer:
- What dropped?
- When did it drop?
- Where did it drop?
- Which queries dropped?
- Which pages dropped?
- Which audience dropped?
- Which device dropped?
- Which business outcome changed?
- What fix matches the pattern?
How do you compare GSC data after Google updates?
After a Google update, compare before and after carefully.
Check:
- Did the drop start near the update?
- Did many pages drop or only one page?
- Did one content type drop?
- Did thin pages drop?
- Did old pages drop?
- Did service pages drop?
- Did informational pages drop?
- Did competitors change?
- Did CTR drop or rankings drop?
- Did AI Overviews appear more often?
Do not assume every drop is from the update.
Check technical SEO first.
Then review content quality.
After updates, improve:
- Search intent match
- Content freshness
- EEAT
- Original insights
- Internal links
- Technical SEO
- Page experience
- Helpful answers
- Trust signals
Google updates often expose weaknesses that already existed.
How do you compare GSC data when AI Overviews reduce clicks?
AI Overviews can reduce clicks even when your page still appears in search.
Look for this pattern:
- Impressions stable
- Average position stable
- CTR down
- Clicks down
- Informational queries affected
- Question-based queries affected
To respond, improve content for AI and users.
Use:
- Question-based headings
- Direct answers
- Short paragraphs
- Clear definitions
- Step-by-step lists
- FAQs
- Expert examples
- Original insights
- Schema-ready structure
- Stronger CTAs
- Better service-page links
AI search may reduce some clicks.
But clear, trusted content can still support visibility, citations, brand awareness, and assisted conversions.
How can Nexora Creation help compare and fix GSC drops?
Nexora Creation helps businesses compare before and after GSC data, diagnose SEO drops, and create recovery strategies based on real evidence.
For SEO drop analysis, we can help with:
- Google Search Console comparison
- Lost query analysis
- Lost page analysis
- Technical SEO diagnosis
- URL Inspection review
- Content decay audit
- Search intent analysis
- Competitor gap review
- Internal linking improvements
- Title and meta updates
- Website development fixes
- Landing page improvements
- CRM lead tracking setup
- AI chatbot lead capture
- Recovery dashboards
The goal is not only to recover traffic.
The goal is to recover qualified visibility, service-page visits, and real leads.
If your GSC data shows an SEO drop but you are not sure what caused it, the safest next step is a structured SEO audit instead of random changes.
What is the best workflow to compare before and after GSC data?
The best workflow is to compare data in layers.
Use this process:
How do you confirm the drop?
Check:
- Clicks
- Impressions
- CTR
- Average position
- Drop date
- Affected search type
- Affected country
- Affected device
How do you identify affected pages?
Check:
- Pages report
- Click loss
- Impression loss
- Position loss
- Service-page impact
- Blog impact
- Lead impact
How do you identify affected queries?
Check:
- Queries report
- Lost keywords
- Buyer-intent queries
- Informational queries
- Branded vs non-branded
- Local queries
- Query groups
How do you diagnose the cause?
Check:
- Indexing
- Technical SEO
- Search intent
- Content decay
- CTR
- Internal links
- Competitors
- SERP features
- Recent website changes
How do you choose the fix?
Choose based on the pattern:
- Technical fix
- Content refresh
- Title/meta rewrite
- Internal link improvement
- Service-page update
- Landing page improvement
- CRM tracking fix
- AI chatbot support
- Website UX improvement
How do you monitor recovery?
Track:
- 7 days
- 28 days
- 60 days
- 90 days
- Queries recovered
- Pages recovered
- Leads recovered
- Service-page visits recovered
This workflow prevents guesswork and keeps SEO recovery focused.
Conclusion
Comparing before and after GSC data during an SEO drop helps you understand what changed before you decide what to fix.
Start with:
- Clicks
- Impressions
- CTR
- Average position
Then review:
- Queries
- Pages
- Devices
- Countries
- Search appearance
- Dates
- Branded vs non-branded traffic
- Service pages vs blog pages
- Lead impact
Do not rely on total traffic alone.
A real SEO diagnosis needs page-level and query-level comparison.
Sometimes the issue is rankings.
Sometimes it is CTR.
Sometimes it is technical SEO.
Sometimes it is search intent.
Sometimes it is a website conversion problem.
The goal is not only to recover traffic.
The goal is to recover the right traffic that supports leads, enquiries, and business growth.
FAQs
How do I compare before and after data in Google Search Console?
Open the Performance report, click the date filter, choose Compare, select two date ranges, turn on clicks, impressions, CTR, and average position, then review queries and pages.
What date range should I use during an SEO drop?
Use last 7 days vs previous 7 days for sudden drops, last 28 days vs previous 28 days for short-term analysis, and last 3 or 6 months vs previous period for bigger trends.
Should I compare queries or pages first?
Check both. Pages show which URLs lost visibility, while queries show which search terms declined. I usually identify affected pages first, then review queries for each page.
What does it mean if impressions dropped in GSC?
Impressions dropping means Google showed your page less often. This may happen because rankings declined, search demand dropped, search intent changed, or technical SEO issues appeared.
What does it mean if clicks dropped but impressions stayed stable?
This usually means CTR declined. Your result may still appear, but fewer users click because of weak titles, meta descriptions, SERP features, AI Overviews, or stronger competitors.
What does it mean if average position dropped?
Average position dropping means your rankings worsened across selected queries. This may happen because of content decay, competitor improvements, technical issues, weak internal links, or intent mismatch.
How do I know if an SEO drop is technical?
A technical drop often happens suddenly after a redesign, migration, plugin update, hosting issue, robots.txt change, noindex mistake, canonical issue, or redirect problem.
Can GSC data show if AI Overviews reduced clicks?
GSC may show patterns such as impressions stable, average position stable, CTR down, and clicks down. That can indicate SERP feature or AI Overview impact, especially for informational queries.
Should I export GSC data?
Yes. Exporting queries and pages helps you sort by click loss, impression loss, CTR change, position change, page type, intent, and business priority.
How do I connect GSC data with leads?
Compare GSC pages and queries with Google Analytics, CRM data, form submissions, phone calls, chatbot leads, and service-page visits to understand which SEO drops affect business outcomes.
How long should I wait after fixing an SEO drop?
Track early changes after 7 and 28 days, but judge SEO recovery over 60 to 90 days depending on crawl frequency, issue severity, content changes, and site authority.
What is the biggest mistake when comparing GSC data?
The biggest mistake is looking only at total clicks. You need to compare queries, pages, CTR, impressions, average position, devices, countries, and lead impact.